

Indonesia Bond Market Directory
Front matter of the 2026 edition: covers, institutional pages, forewords and the introduction of the directory.
IBMD 2026
IDX 1

IDX 2

IDX 3
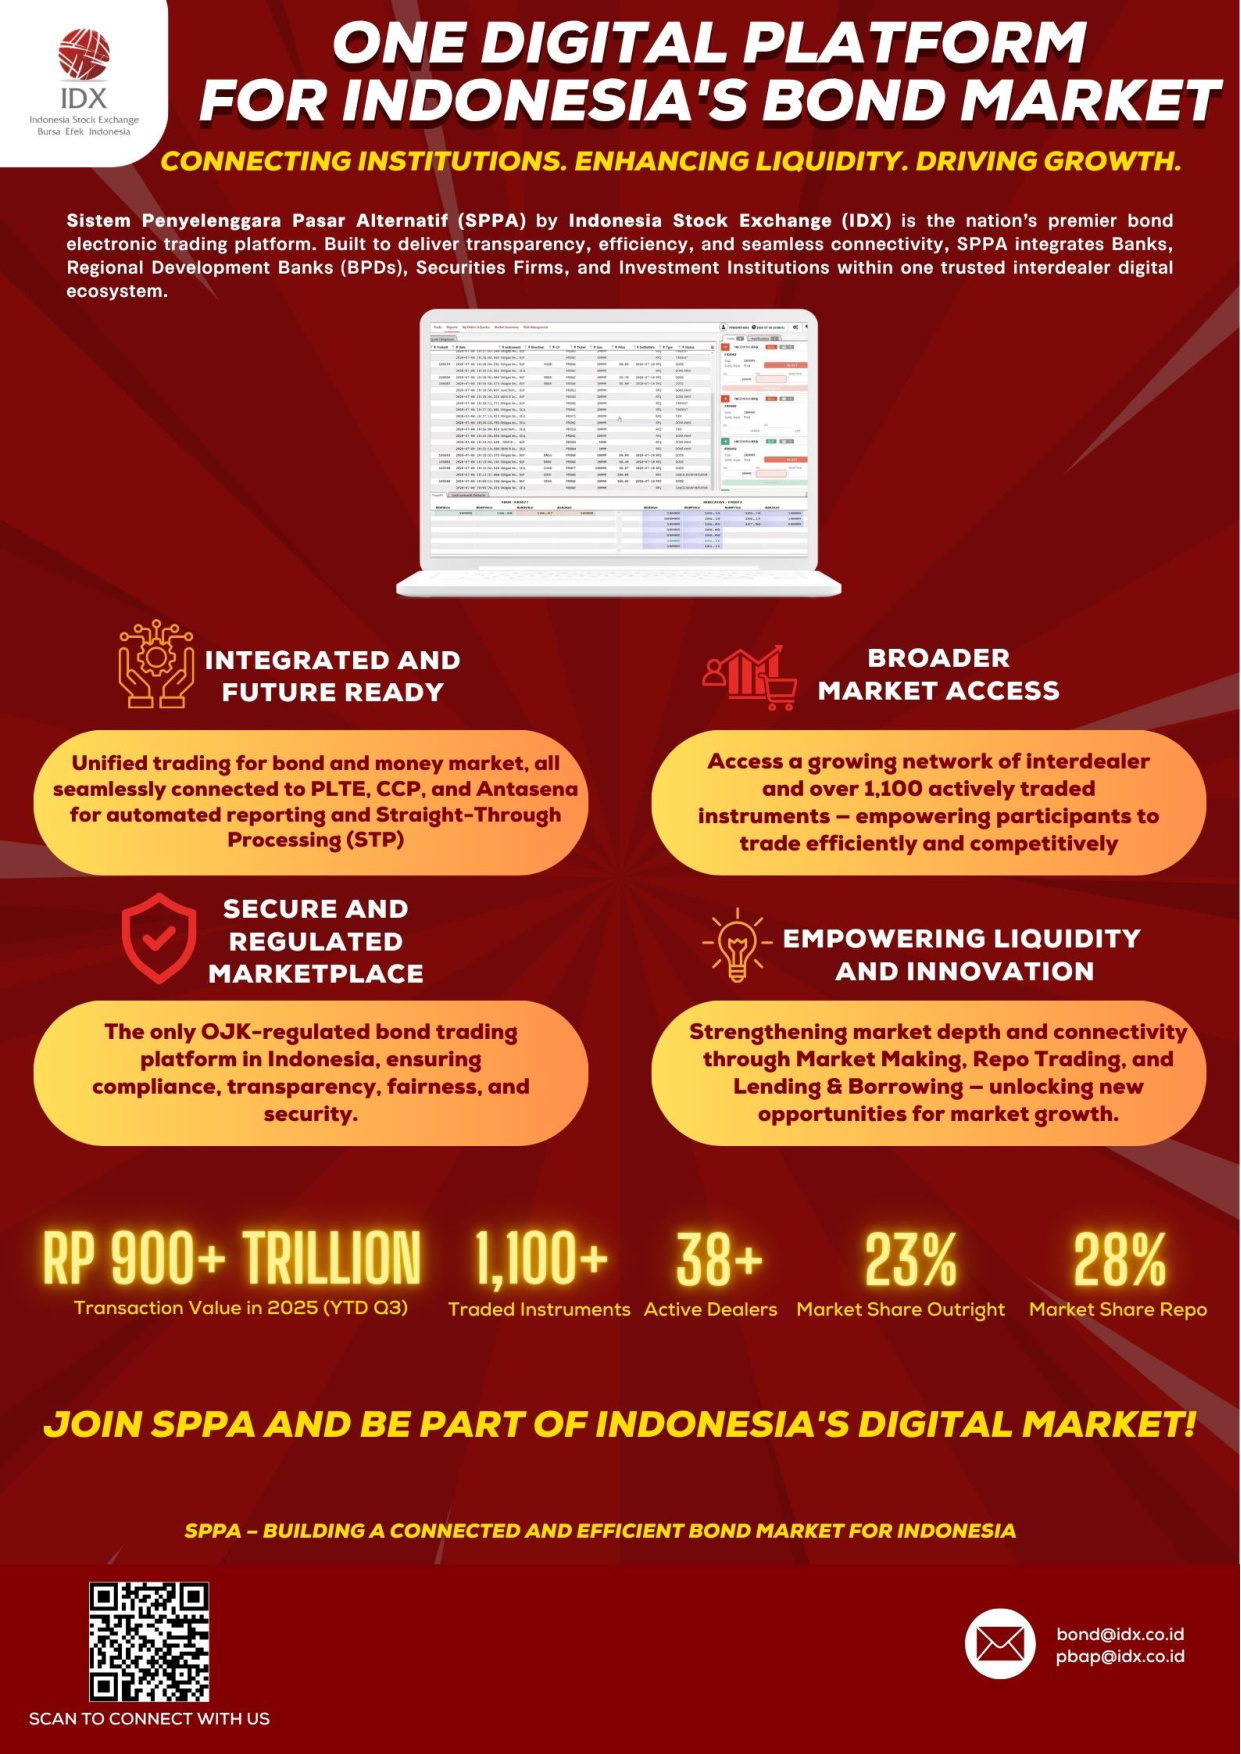
KPEI

KSEI

Page RMI PHEI
Taruh berkas bernama Page RMI PHEI.jpg (atau .png) di assets/img/pages/ — otomatis tampil di sini saat node build.js dijalankan.
About IBMD 2026
2025 edition material
This page reproduces the front matter of the 2025 printed edition and is awaiting replacement with the 2026 text. Year figures are transcribed as printed.
The Indonesia Bond Market Directory is the annual reference to every debt security listed and traded in Indonesia — government and corporate, conventional and sharia.
This edition combines the review of the economy and the bond market with the directory sections: issuer profiles, outstanding series, trading highlights and the PHEI index family. Data are presented as at the cut-off date stated in each table.
Publication
Indonesia Bond Market Directory 2025
Research and Market Information Department, PT. Penilai Harga Efek Indonesia
IBMD was published in collaboration between PT Penilai Harga Efek Indonesia and PT Bursa Efek Indonesia.
- © 2025 PT Bursa Efek Indonesia — Indonesia Stock Exchange Building, Tower 1, Jln. Jend. Sudirman Kav. 52–53, Jakarta 12190 — www.idx.co.id
- Published by PT Penilai Harga Efek Indonesia — Indonesia Stock Exchange Building, Tower 2, GF, Jln. Jend. Sudirman Kav. 52–53, Jakarta 12190 — www.phei.co.id
- All rights reserved. Published 2025. Printed in Indonesia.
Rights and Permissions
This publication is copyrighted. Copying and/or transmitting portions or all of this work without permission may be a violation of Law of The Republic of Indonesia Number 19 Year 2002 Regarding Copyright.
Disclaimer
The facts and opinions stated or expressed in this publication are for information purposes only and are not necessarily and must not be relied upon as being those of the publisher or of the institutions for which the contributing authors work. Although every care has been taken to ensure the accuracy of the information contained within the publication it should not be by any person relied upon as the basis for taking any action or making any decision. PT Penilai Harga Efek Indonesia cannot be held liable or otherwise responsible in any way for any advice action taken or decision made on the basis of the facts and opinions stated or expressed or stated within this publication.
Data Notes
The trading data on this publication was taken on July 1, 2025. If in the future, any cancelation occurs on the securities transaction that was submitted by Participant or if any late reporting occurs in reporting the securities transaction performed by Participant, then such data may be revised at any time. Trading highlight data in government and corporate bond sections is based on outright and repo types of transaction.
All financial statement data are based on issuers’ financial reports for full year 2024 and 2023 that are recorded on XBRL system of IDX. All financial accounts are displayed in Indonesia rupiah (IDR). Any original published financial statement denominated in U.S. dollars (USD) are converted to IDR with end of year exchange mid-rate of Bank Indonesia.
The profile of bond issuers data are as of June 2025 that are taken from IDXnet reporting system.
Dollar figures ($) are current U.S. dollars, unless otherwise specified. Billion means 1,000 million; trillion means 1,000 billion.
Forewords OJK
2025 edition material
This page still carries material from the 2025 edition and is awaiting replacement. The year figures are reproduced as printed because the foreword is a signed statement.
Chief Executive of Capital Market, Financial Derivatives, and Carbon Exchange Supervision, Otoritas Jasa Keuangan
Praise be to God Almighty, for by His grace, the Financial Services Authority (OJK) is once again able to present the Indonesia Bond Market Directory (IBMD) 2025, together with all stakeholders, as a comprehensive reference for all participants and observers of the Indonesian capital market.
Throughout 2024 and into 2025, the global economy has continued to be characterised by uncertainty due to slower growth, geopolitical tensions, persistently high interest rates and tariffs, and the challenges of the energy transition. Despite these challenges, the Indonesian bond market has shown resilience. The Indonesia Composite Bond Index (ICBI) recorded a positive performance, reflecting investor confidence in the domestic bond market as a stable, long-term investment instrument. This development also reaffirms the vital role of the bond market in supporting financial market deepening and financing national development, particularly in line with the Asta Cita 2025–2029 agenda to achieve inclusive and sustainable economic growth.
As the regulator, the OJK continues to strengthen the bond market's foundation by issuing strategic policies that align with the mandate of the Financial Sector Development and Strengthening Law (UU P2SK). One such policy is POJK No. 33 of 2024 on the development and strengthening of investment management, which is expected to expand the investor base and improve the quality of bond-based investment products. Additionally, POJK No. 32 of 2024 on the development and strengthening of securities transactions and institutions was issued to enhance transparency, efficiency and investor confidence in bond market transactions. These policy measures are part of OJK’s ongoing efforts to ensure that the bond market grows in credibility, liquidity, and competitiveness as well as in quantity. In line with this, PT Penilai Harga Efek Indonesia (PHEI) has played an important role in providing reliable data, references and insights for all stakeholders through the preparation of IBMD.
We hope that IBMD 2025 will further strengthen transparency, enhance market literacy and support sound investment decision-making. This will enable the Indonesian bond market to grow in depth and inclusivity, and become more sustainable, thereby contributing to national development financing.
Inarno Djajadi
Chief Executive of Capital Market, Financial Derivatives, and Carbon Exchange Supervision Financial Services Authority (OJK)
Forewords IDX

2025 edition material
This page still carries material from the 2025 edition and is awaiting replacement. The year figures are reproduced as printed because the foreword is a signed statement.
President Director of Indonesia Stock Exchange (IDX)
The bond market is one of the key segments that enhances the value and depth of the Indonesian Capital Market. It offers a wide variety of debt instruments, ranging from conventional bonds and sukuk to green bonds. In 2024, there were 69 corporate bond/sukuk issuers, comprising 144 new listings of corporate bonds/sukuk that raised a total of IDR143.5 trillion (USD8.8 billion). Overall, the total funds raised by both government and corporate bonds reached IDR1,008.8 trillion (USD62.4 billion).
The Indonesian bond market has grown significantly, with the total outstanding value reaching approximately IDR6,512 trillion (USD 402.9 billion) by the end of 2024, reflecting an increase of around 5.14% compared to the previous year. The market remains dominated by government bonds, which account for approximately 92.75% of the total outstanding value, while corporate bonds represent around 7.25%. Indonesia Stock Exchange supports and appreciates PT Penilai Harga Efek Indonesia (PHEI) for publishing “Indonesia Bond Market Directory” (IBMD), a reliable and comprehensive source of information on the Indonesian bond market for investors. Since its first edition in 2011, IBMD has become a valuable reference for the Indonesian Capital Markets, particularly in the bond market segment.
I am certain that IBMD will continue to provide valuable insights for investors and enhance literacy and understanding of bond-related data. I hope this publication will further support the growth and development of Indonesia’s bond market. Thank you.
Iman Rachman President Director Indonesia Stock Exchange
Forewords PHEI

2025 edition material
This page still carries material from the 2025 edition and is awaiting replacement. The year figures are reproduced as printed because the foreword is a signed statement.
President Director of PT Penilai Harga Efek Indonesia
The year 2025 marks a period of steady progress for Indonesia’s bond market. As the global economy evolves and the focus on sustainable financing intensifies, the bond market continues to play a vital role in supporting national funding and maintaining financial stability.
In this context, the publication of the Indonesia Bond Market Directory (IBMD) 2025, a collaboration between PT Penilai Harga Efek Indonesia (PHEI) and PT Bursa Efek Indonesia (IDX), reflects our shared commitment to promoting transparency, integrity, and accountability in bond market information.
PHEI continues to serve as a trust enabler in Indonesia’s bond market by delivering fair, objective, and independent valuation services. In an increasingly data-driven environment, reliable and credible information forms the foundation of investor and market confidence. Through the IBMD, we aim not only to present easily accessible data, but also to provide a comprehensive overview of Indonesia’s bond market.
The IBMD also highlights the importance of collaboration among bond market stakeholders. PHEI believes that market stability can best be achieved through consistent coordination among regulators, market infrastructure institutions, issuers, investors, and intermediaries. Strengthened collaboration is essential to developing a bond market that is efficient, credible, and sustainable.
The IBMD 2025, along with its future editions, represents PHEI’s continued commitment to supporting the growth of a transparent and trustworthy bond market ecosystem.
As a final note, we would like to express our sincere gratitude to the IDX for its continued support to PHEI and the Indonesian bond market, as well as to the Otoritas Jasa Keuangan and all institutions that contributed to the publication of the IBMD 2025. May this collaboration continue to drive the development of an integrated, competitive, and sustainable bond market in Indonesia.
M. Kadhafi Mukrom President Director PT Penilai Harga Efek Indonesia
About PHEI
2025 edition material
This company profile is reproduced from the 2025 printed edition and is awaiting confirmation for 2026.
PT Penilai Harga Efek Indonesia (PHEI) is the first and only licensed independent Securities Pricing Agency in Indonesia that focuses itself in valuating and pricing the Indonesia fixed income securities, sukuk, and other securities.
PHEI acquired its license as the official securities pricing agency in Indonesia from Bapepam-LK (Indonesia Securities and Financial Institution Supervisory Board — now Financial Service Authority or OJK) in August 2009. Since then, PHEI provides daily fair price market and yield information for all Indonesian government bonds and sukuk, as well as investment-grade corporate bonds and Sukuk. PHEI’s mission is to support the development of the Indonesian fixed income market in order to become more orderly, efficient, liquid and transparent.
The transparency that PHEI promotes to the Indonesia fixed income market contributes to growth in primary and secondary markets encourage product innovations and improves the quality of financial management in any institution which owns fixed-income securities and sukuk in their portfolios.
The availability of reliable fair prices for bonds, sukuk, and other securities from PHEI will in turn provide investors, market participants, and regulator a clearer view of the market, better understanding and improve every investment decision related to Indonesia fixed income markets.
Table of Contents
The printed edition carries the full table of contents here. The list below is generated from the live structure of this website, so it always matches what is published — use the sidebar menu or the search box to jump straight to an issuer or section.
1 Indonesia Bond Market Directory
2 Economic and Bond Market Review
3 Indonesia Bond Market Guidance
4 Government Bonds
5 Corporate Bonds
- ADCP PT Adhi Commuter Properti Tbk.
- ADHI PT Adhi Karya (Persero) Tbk.
- ADMF PT Adira Dinamika Multi Finance Tbk.
- AGII PT Aneka Gas Industri Tbk.
- AKRA PT AKR Corporindo Tbk.
- APAI PT Angkasa Pura I (Persero)
- APIA PT Angkasa Pura II (Persero)
- ARKO PT Arkora Hydro Tbk.
- ARMA PT Armadian Tritunggal
- ASDF PT Astra Sedaya Finance
- BACA PT Bank Capital Indonesia Tbk.
- BAFI PT Bussan Auto Finance
- BALI PT Bali Towerindo Sentra Tbk.
- BBCA PT Bank Central Asia Tbk.
- BBIA PT Bank UOB Indonesia
- BBKP PT Bank Bukopin Tbk.
- BBNI PT Bank Negara Indonesia (Persero) Tbk.
- BBRI PT Bank Rakyat Indonesia (Persero) Tbk.
- BBTN PT Bank Tabungan Negara (Persero) Tbk.
- BCAP PT MNC Kapital Indonesia Tbk.
- BEXI Indonesia Eximbank
- BFIN PT BFI Finance Indonesia Tbk.
- BIIF PT Maybank Indonesia Finance
- BJBR PT Bank Pembangunan Daerah Jawa Barat Dan Banten Tbk.
- BMRI PT Bank Mandiri (Persero) Tbk.
- BMTP PT Bank Mandiri Taspen
- BMTR PT Global Mediacom Tbk.
- BNGA PT Bank CIMB Niaga Tbk.
- BNII PT Bank Maybank Indonesia Tbk.
- BNTT PT Bank Pembangunan Nusa Tenggara Timur
- BOLD PT Bukit Makmur Mandiri Utama
- BRIF PT BRI Multifinance Indonesia
- BRIS PT Bank Syariah Indonesia Tbk.
- BRPT PT Barito Pacific Tbk.
- BSDE PT Bumi Serpong Damai Tbk.
- BSIM PT Bank Sinarmas Tbk.
- BSLT Bank Sulutgo
- BSMT PT Bank Pembangunan Daerah Sumatera Utara
- BSSB PT Bank Pembangunan Daerah Sulawesi Selatan dan Sulawesi Barat
- BTPN PT Bank Tabungan Pensiunan Nasional Tbk.
- BVIC PT Bank Victoria International Tbk.
- CNAF PT CIMB Niaga Auto Finance
- DART PT Duta Anggada Realty Tbk.
- DILD PT Intiland Development Tbk.
- DNRK PT Danareksa (Persero)
- DSNG PT Dharma Satya Nusantara Tbk.
- DSSA PT Dian Swastatika Sentosa Tbk.
- ELSA PT Elnusa Tbk.
- EMIN PT Energi Mitra Investama
- EXCL PT XL Axiata Tbk.
- FIFA PT Federal International Finance
- FMFN PT KB Finansia Multi Finance
- HEAL PT Medikaloka Hermina Tbk.
- HIFI PT Hino Finance Indonesia
- HRTA PT Hartadinata Abadi Tbk.
- IATA PT MNC Energy Investments Tbk.
- IIFF PT Indonesia Infrastructure Finance
- IMFI PT Indomobil Finance Indonesia
- INKP PT Indah Kiat Pulp & Paper Tbk.
- ISAT PT Indosat Tbk.
- ISSP PT Steel Pipe Industry Of Indonesia Tbk.
- JSMR PT Jasa Marga (Persero) Tbk.
- KAII PT Kereta Api Indonesia (Persero)
- KETR PT Ketrosden Triasmitra
- LPPI PT Lontar Papyrus Pulp & Paper Industry
- LTLS PT Lautan Luas Tbk.
- MAYA PT Bank Mayapada Internasional Tbk.
- MBMA PT Merdeka Battery Materials Tbk.
- MDKA PT Merdeka Copper Gold Tbk.
- MEDC PT Medco Energi Internasional Tbk.
- MEDP PT Medco Power Indonesia
- MFIN PT Mandala Multifinance Tbk.
- MLJK PT Marga Lingkar Jakarta
- MORA PT Mora Telematika Indonesia
- MPMF PT Mitra Pinasthika Mustika Finance
- MYOR PT Mayora Indah Tbk.
- NITA PT Nirmala Taruna
- OPPM PT OKI Pulp & Paper Mills
- OTMA PT Oto Multiartha
- PALM PT Provident Investasi Bersama Tbk.
- PIDL PT Pindo Deli Pulp And Paper Mills
- PIHC PT Pupuk Indonesia (Persero)
- PIKI PT Pelabuhan Indonesia IV (Persero)
- PJAA PT Pembangunan Jaya Ancol Tbk.
- PLTM PT Polytama Propindo
- PNBN PT Bank Pan Indonesia Tbk.
- PNMP PT Permodalan Nasional Madani (Persero)
- POST PT Pos Indonesia (Persero)
- PPAP PT Perusahaan Pengelola Aset (Persero)
- PPGD PT Pegadaian (Persero)
- PPLN PT Perusahaan Listrik Negara (Persero)
- PPRE PT PP Presisi Tbk.
- PPRO PT PP Properti Tbk.
- PRTL PT Profesional Telekomunikasi Indonesia
- PSAB PT J Resources Asia Pasifik Tbk.
- PTHK PT Hutama Karya (Persero)
- PTPP PT PP (Persero) Tbk.
- PYFA PT Pyridam Farma Tbk.
- REFI PT Usaha Pembiayaan RelianceIndonesia
- SANF PT Surya Artha Nusantara Finance
- SGRO PT Sampoerna Agro Tbk.
- SMAR PT Sinar Mas Agro Resources and Technology Tbk.
- SMDR PT Samudera Indoensia Tbk.
- SMFP PT Sarana Multigriya Finansial (Persero)
- SMGR PT Semen Indonesia (Persero) Tbk.
- SMII PT Sarana Multi Infrastruktur (Persero)
- SMMA PT Sinar Mas Multiartha Tbk.
- SMMF PT Sinar Mas Multifinance
- SMRA PT Summarecon Agung Tbk.
- SRAJ PT Sejahteraraya Anugerahjaya Tbk.
- TAFS PT Toyota Astra Financial Services
- TBIG PT Tower Bersama Infrastructure Tbk.
- TBLA PT Tunas Baru Lampung Tbk.
- TDPM PT Tridomain Performance Materials Tbk.
- TELE PT Tiphone Mobile Indonesia Tbk.
- TINS PT Timah Tbk.
- TLKM PT Telekomunikasi Indonesia (Persero) Tbk.
- TOBA PT TBS Energi Utama Tbk.
- TPIA PT Chandra Asri Petrochemical Tbk.
- TRIM PT Trimegah Sekuritas Indonesia Tbk.
- TUFI PT Mandiri Tunas Finance
- TYRO PT Tamaris Hydro
- VOKS PT Voksel Electric Tbk.
- WIKA PT Wijaya Karya (Persero) Tbk.
- WISL PT Wahana Inti Selaras
- WOMF PT Wahana Ottomitra Multiartha Tbk.
- WOOD PT Integra Indocabinet Tbk.
- WSBP PT Waskita Beton Precast Tbk.
- WSKT PT Waskita Karya (Persero) Tbk.
- ZINC PT Kapuas Prima Coal Tbk.
6 Bond Market Indicator
The New BIPS
[Introduction of the new Bond Information and Pricing Services (BIPS) platform.]
[Feature overview, access, and subscription information.]
This recording is from the 2024 edition and is awaiting replacement.
Economic and Bond Market Review
The opening review sets the macroeconomic scene for the year and traces how it played through the bond market — closing with the most traded and best performing series of the year.
Global Economy
2025 edition material
This chapter carries the economic review of the 2025 edition and is awaiting replacement with 2026 data. Figures and cut-off dates are reproduced as published.
Global economic growth showing moderate resilience
The global economy in 2025 is showing moderate resilience and expected to operating below long-run historical trend levels. According to recent forecasts, global GDP growth is projected at around 3.0 % in 2025, and increase to perhaps 3.1 % in 2026, depending on developments in trade, investment and policy.
While some regions are performing better than expected, the overall picture remains one of sub-trend growth and significant divergence across advanced vs emerging economies.
G20 economic growth projection
- 2025 Forecast
- 2026 Forecast
Figures behind this chart
| Period | 2025 Forecast | 2026 Forecast |
|---|---|---|
| World | 3.0% | 3.1% |
| United States | 1.9% | 2.0% |
| China | 4.8% | 4.2% |
| Euro Area | 1.0% | 1.2% |
| Japan | 0.7% | 0.5% |
| Germany | 0.1% | 0.9% |
| United Kingdom | 1.2% | 1.4% |
| France | 0.6% | 1.0% |
| India | 6.4% | 6.4% |
| Italy | 0.5% | 0.8% |
| Canada | 1.6% | 1.9% |
| Korea | 0.8% | 1.8% |
| Russia | 0.9% | 1.0% |
| Brazil | 2.3% | 2.1% |
| Australia | 1.8% | 2.2% |
| Spain | 2.5% | 1.8% |
| Mexico | 0.2% | 1.4% |
| Indonesia | 4.8% | 4.8% |
| Netherlands | 1.2% | 1.2% |
| Turkey | 3.0% | 3.3% |
| Saudi Arabia | 3.6% | 3.9% |
Source: International Monetary Fund as of Jul 2025, processed by PHEI
- 2025F
- 2026F
Figures behind this chart
| Period | 2025F | 2026F |
|---|---|---|
| IMF | 3.0% | 3.1% |
| OECD | 3.2% | 2.9% |
| World Bank | 2.3% | 2.4% |
- 2025F
- 2026F
Figures behind this chart
| Period | 2025F | 2026F |
|---|---|---|
| IMF | 4.8% | 4.8% |
| OECD | 4.9% | 4.9% |
| World Bank | 4.7% | 4.8% |
Source: International Monetary Fund, World Bank, and OECD, processed by PHEI
High volatility in markets
Financial markets in 2025 are characterised by heightened volatility and increasing sensitivity to a mix of factors. VIX Index which often used by investors to evaluate market sentiment and perceived risk, shows a significant increase in April 2025 by more than 200% before it calms down to 19% in September 2025.
Figures behind this chart
| First | Latest | Lowest | Highest | |
|---|---|---|---|---|
| VIX | 17.352024-12-31 | 16.282025-09-30 | 14.222025-08-22 | 52.332025-04-08 |
Source: Bloomberg, processed by PHEI
Why volatility is elevated
- Geopolitical shocks. Regions of strategic importance remain volatile, triggering jumps in commodity prices, safe-haven flows (into gold, U.S. Treasuries), and risk premia.
- Monetary policy uncertainty. Markets are trying to anticipate central-bank actions especially when and how rapidly the Federal Reserve will cut rates, but diverging signals, shifting labour/inflation data, and global spill-overs mean guidance is less clear. This feeds speculative repositioning and reactive trading.
- Tariff and trade policy risk. The fresh wave of U.S. tariff threats, counter-measures by trading partners, and trade-policy uncertainty more broadly mean that investor expectations of global growth, supply-chain normalisation, and corporate profitability are under revision.
Elevated geopolitical risk
Geopolitical risk in 2025 remains a key structural challenge for the global economy and markets, and it is increasingly intertwined with economic, trade and technology domains. This means the economic consequences are broader than classic military or diplomatic flash-points.
Geopolitical instability remains one of the two top-ranked risks (alongside trade/trade-policy). While dramatic escalation leading to a global crisis remains a lower-probability scenario, the baseline expectation is for fluid, elevated-risk conditions rather than “normal” low-risk stability. Geopolitical risk are now treated as a recurring background condition rather than an external shock. Given this, resilience and diversification have become more valued.
Nature and sources of the risk
The nature and sources of risk stemming from high geopolitical tension are rooted in the growing fragmentation of global power, the resurgence of strategic rivalries, and the weaponization of economic interdependence. These tensions manifest through armed conflicts, trade restrictions, sanctions, cyberattacks, and energy-supply disruptions that collectively erode global stability. The nature of the risk is systemic, as it simultaneously impacts security, economics, and finance—raising uncertainty, deterring investment, and amplifying market volatility. Its sources include persistent conflicts such as the Russia–Ukraine war, the Iran–Israel confrontation, heightened U.S.–China strategic competition, and the politicization of global trade and technology flows. The economic implications are broad: supply-chain fragmentation, elevated energy and commodity prices, inflation persistence, and capital flight to safe-haven assets.
War in Ukraine
The war in Ukraine, which began with Russia’s full-scale invasion in February 2022, has evolved into a protracted and costly conflict that continues to reshape the global economic and security landscape. As of late 2025, the fighting remains concentrated along the eastern and southern fronts, with neither side achieving decisive territorial gains. The war has inflicted severe human and infrastructure losses, millions displaced and over half of Ukraine’s energy grid damaged, while sanctions on Russia and trade disruptions have reverberated worldwide.
Iran’s conflict with Israel and the United States
The Iran–Israel confrontation, which escalated sharply in mid-2025 following Israeli and U.S. airstrikes on Iranian nuclear facilities, has deepened instability across the Middle East and introduced new geopolitical risks to global energy markets. The strikes—triggered by concerns over Iran’s accelerating uranium enrichment and missile capabilities, provoked retaliatory attacks on regional energy and shipping infrastructure, briefly pushing Brent crude above US$95 per barrel and reigniting inflationary pressures worldwide. Financial markets reacted with heightened volatility, while insurance and freight costs surged in the Strait of Hormuz and Eastern Mediterranean routes.
Source: Various sources, processed by PHEI
Uncertainty in monetary policy
By September 2025, the global monetary policy landscape is defined by divergence and uncertainty. After holding rates steady for nearly a year, the U.S. Federal Reserve finally delivered its first rate cut in September—lowering the federal funds target range to 4.00–4.25%, amid signs of cooling inflation and a softening labor market.
Headline CPI stands 2.9% in September 2025, with core inflation broadly stable, while job creation has slowed and unemployment has edged up to around 4.3%, suggesting a gradual loss of labor-market momentum.
Figures behind this chart
| First | Latest | Lowest | Highest | |
|---|---|---|---|---|
| Fed funds target | 0.25%Dec 2021 | 3.50%Dec 2026 | 0.25%Dec 2021 | 5.50%Jul 2023 |
Source: FOMC Minutes, processed by PHEI
The series is reproduced as printed and runs to December 2026; values after September 2025 are the forward path carried in the source deck, not realised rates.
- CPI YoY
- Core CPI YoY
- CPI MoM
Figures behind this chart
| First | Latest | Lowest | Highest | |
|---|---|---|---|---|
| CPI YoY | 7.00%Dec 2021 | 2.90%Dec 2026 | 2.30%Apr 2025 | 9.10%Jun 2022 |
| Core CPI YoY | 5.50%Dec 2021 | 3.10%Sep 2025 | 2.80%Mar 2025 | 6.60%Sep 2022 |
| CPI MoM | 0.70%Dec 2021 | 0.40%Sep 2025 | -0.10%Mar 2025 | 1.30%Jun 2022 |
Source: Bloomberg, processed by PHEI
Figures behind this chart
| First | Latest | Lowest | Highest | |
|---|---|---|---|---|
| Unemployment rate | 3.90%Dec 2021 | 4.30%Sep 2025 | 3.40%Apr 2023 | 4.30%Aug 2025 |
Figures behind this chart
| First | Latest | Lowest | Highest | |
|---|---|---|---|---|
| Non-farm payrolls | 575kDec 2021 | 22kAug 2025 | -13kJun 2025 | 869kFeb 2022 |
Source: Bloomberg, processed by PHEI
Monthly change in non-farm payrolls, in thousands.
Across the Atlantic, the European Central Bank has eased by about 100 bps since late 2024, bringing its deposit rate to 2.15%, as euro-area inflation normalized toward target and growth stagnated. The Bank of England, in contrast, has trimmed its Bank Rate from 4.75% to 4.00%, balancing easing pressures with sticky inflation near 3.8%. In Asia, the People’s Bank of China has maintained an accommodative stance, keeping the 1-year Loan Prime Rate at 3.00% to support a slowing economy, while the Bank of Japan remains cautious after ending negative rates earlier, holding at 0.50% since January 2025.
This divergence Fed easing, ECB and BoE cautiously cutting, PBOC steady, and BoJ normalizing, underscores a fragmented global monetary cycle, amplifying exchange-rate volatility, capital-flow shifts, and uncertainty over the next phase of policy coordination.
- Policy rate
- CPI
Figures behind this chart
| First | Latest | Lowest | Highest | |
|---|---|---|---|---|
| Policy rate | 0.00%Jan 2021 | 2.15%Sep 2025 | 0.00%Jan 2021 | 4.50%Sep 2023 |
| CPI | 0.90%Jan 2021 | 2.20%Sep 2025 | 0.90%Jan 2021 | 10.60%Oct 2022 |
| Rate at end of 2024 | Current rate (Sep 2025) |
|---|---|
| 3.15% | 2.15% |
- Policy rate
- CPI
Figures behind this chart
| First | Latest | Lowest | Highest | |
|---|---|---|---|---|
| Policy rate | 0.10%Jan 2021 | 4.00%Sep 2025 | 0.10%Jan 2021 | 5.25%Aug 2023 |
| CPI | 0.70%Jan 2021 | 3.80%Sep 2025 | 0.40%Feb 2021 | 11.10%Oct 2022 |
| Rate at end of 2024 | Current rate (Sep 2025) |
|---|---|
| 4.75% | 4.00% |
- Policy rate
- CPI
Figures behind this chart
| First | Latest | Lowest | Highest | |
|---|---|---|---|---|
| Policy rate | -0.10%Jan 2021 | 0.50%Sep 2025 | -0.10%Jan 2021 | 0.50%Jan 2025 |
| CPI | -0.70%Jan 2021 | 2.70%Aug 2025 | -1.10%Apr 2021 | 4.30%Jan 2023 |
| Rate at end of 2024 | Current rate (Sep 2025) |
|---|---|
| 0.25% | 0.50% |
- Policy rate
- CPI
Figures behind this chart
| First | Latest | Lowest | Highest | |
|---|---|---|---|---|
| Policy rate | 4.15%Jan 2020 | 3.00%Aug 2025 | 3.00%May 2025 | 4.15%Jan 2020 |
| CPI | 5.40%Jan 2020 | -0.30%Sep 2025 | -0.80%Jan 2024 | 5.40%Jan 2020 |
| Rate at end of 2024 | Current rate (Sep 2025) |
|---|---|
| 3.10% | 3.00% |
Source: Bloomberg, processed by PHEI
U.S. reciprocal tariffs
As of September 2025, the United States’ realized effective tariff rate remains historically elevated, reflecting the cumulative effects of the Trump administration’s “Reciprocal Tariff” policy and subsequent renegotiations with key trading partners.
According to Bloomberg, the U.S. effective tariff rate averages around 14.60% (15 countries in the table), up significantly from the pre-2025 baseline of roughly 7.51%, even after accounting for partial suspensions and temporary reductions under the May–August 2025 tariff pause. Although this rate is slightly below the levels anticipated in earlier forecasts due to limited easing in bilateral agreements particularly with China, Indonesia, and the EU, it continues to weigh on global trade flows and price stability. These higher tariffs, alongside persistent trade uncertainty, have introduced a quasi-supply shock to the global economy, amplifying input costs for manufacturers and raising consumer prices in the U.S.
Reciprocal tariff rates by trading partner
| No | Country | New Tariff Rate* | Previous/Typical Tariff Rate** | Announced / Updated |
|---|---|---|---|---|
| 1 | China | 30 % (avg.) | ~10 % (pre-2025) | May-2025 |
| 2 | India | 50% | ~25–26 % | Aug 27 2025 |
| 3 | Japan | 15% | ~24 % | Aug-2025 |
| 4 | South Korea | 15% | ~25 % | Aug-2025 |
| 5 | Indonesia | 19% | ~32 % | Jul-2025 |
| 6 | Thailand | 19% | ~36 % | Jul-2025 |
| 7 | Vietnam | 20% | ~46 % | Jul-2025 |
| 8 | Mexico | 25% | ~2–3 % | Oct 2025 (scheduled) |
| 9 | European Union (EU) | 15% | ~20 % | Aug-2025 |
| 10 | Canada | 35% | ~2–3 % (under prior USMCA) | Aug-2025 |
*New Tariff Rate refers to the effective headline rate under the Trump administration’s “Reciprocal Tariffs” framework as of September 2025. **Previous / Typical Tariff Rate reflects most-favored-nation or pre-policy levels prior to 2025 changes. Source: Bloomberg, processed by PHEI
From a macroeconomic perspective, the sustained elevation in U.S. tariff rates has produced asymmetric spillovers: while the U.S. enjoys a short-term boost in tariff revenue (offsetting part of its fiscal deficit increase), emerging markets and export-dependent economies face slower growth and reduced investment flows.
Realized effective U.S. tariff rates
| No | Country | Latest | 12M MA | Changes % |
|---|---|---|---|---|
| 1 | China | 40.36% | 24.87% | 15.49% |
| 2 | Bangladesh | 24.63% | 17.38% | 7.25% |
| 3 | United Arab Emirates | 17.33% | 5.91% | 11.42% |
| 4 | Cambodia | 15.25% | 9.64% | 5.61% |
| 5 | Japan | 14.75% | 6.32% | 8.43% |
| 6 | Turkey | 13.72% | 6.57% | 7.15% |
| 7 | South Korea | 13.05% | 4.51% | 8.54% |
| 8 | Indonesia | 12.51% | 6.88% | 5.63% |
| 9 | Germany | 11.21% | 4.85% | 6.36% |
| 10 | Italy | 10.72% | 4.78% | 5.94% |
| 11 | Spain | 10.51% | 4.45% | 6.06% |
| 12 | Vietnam | 9.24% | 5.11% | 4.13% |
| 13 | Brazil | 9.20% | 4.01% | 5.19% |
| 14 | India | 8.56% | 4.13% | 4.43% |
| 15 | France | 8.03% | 3.25% | 4.78% |
Source: Bloomberg, processed by PHEI
While effective tariff rates have stabilized below their April 2025 peaks, the global trade system continues to operate under a regime of elevated costs, structural inefficiencies, and heightened policy unpredictability—posing lasting risks to both inflation control and cross-border growth momentum.
Indonesia Economy
2025 edition material
This chapter carries the review of the 2025 edition and is awaiting replacement with 2026 data. Figures and cut-off dates are reproduced as published.
Indonesia economy showed sustained growth amid global uncertainty
Indonesia’s economy maintained its growth momentum in 2025, with GDP expanding by 5.12% in Q2 and full-year growth expected to reach around 5.2%, slightly higher than 2024. The improvement reflects robust domestic demand, underpinned by resilient household consumption supported by controlled inflation, solid employment conditions, and rising consumer confidence. On the investment front, activity remains strong particularly in infrastructure, manufacturing, and downstream mineral industries reflecting continued confidence in Indonesia’s structural transformation agenda. Despite external headwinds from moderating global demand and lower commodity prices, the economy continues to demonstrate macroeconomic stability, with a manageable fiscal deficit, a stable currency, and inflation within Bank Indonesia’s target range.
Figures behind this chart
| Period | GDP growth, year on year |
|---|---|
| Q1 2020 | 2.97% |
| Q2 2020 | -5.32% |
| Q3 2020 | -3.49% |
| Q4 2020 | -2.19% |
| FY 2020 | -2.07% |
| Q1 2021 | -0.71% |
| Q2 2021 | 7.07% |
| Q3 2021 | 3.51% |
| Q4 2021 | 5.02% |
| FY 2021 | 3.69% |
| Q1 2022 | 5.02% |
| Q2 2022 | 5.46% |
| Q3 2022 | 5.73% |
| Q4 2022 | 5.01% |
| FY 2022 | 5.31% |
| Q1 2023 | 5.04% |
| Q2 2023 | 5.17% |
| Q3 2023 | 4.94% |
| Q4 2023 | 5.04% |
| FY 2023 | 5.05% |
| Q1 2024 | 5.11% |
| Q2 2024 | 5.05% |
| Q3 2024 | 4.95% |
| Q4 2024 | 5.02% |
| FY 2024 | 5.03% |
| Q1 2025 | 4.87% |
| Q2 2025 | 5.12% |
| 2025 F | 5.20% |
Source: Indonesia Central Bureau of Statistics (BPS), processed by PHEI
- Household Consumption
- Gross Fixed Capital Formation
- Government Consumption
- Net Export-Import
- Consumption of Non-Profit Institutions Serving Households
- Others
Figures behind this chart
| Period | Household Consumption | Gross Fixed Capital Formation | Government Consumption | Net Export-Import | Consumption of Non-Profit Institutions Serving Households | Others |
|---|---|---|---|---|---|---|
| 2021 | 1.09% | 1.21% | 0.34% | 0.99% | 0.02% | 0.04% |
| 2022 | 2.61% | 1.24% | -0.37% | 0.81% | 0.07% | 0.95% |
| 2023 | 2.55% | 1.38% | 0.22% | 0.66% | 0.12% | 0.12% |
| 2024 | 2.60% | 1.43% | 0.48% | -0.01% | 0.16% | 0.37% |
| Q1-2025 | 2.61% | 0.65% | -0.08% | 0.83% | 0.04% | 0.82% |
| Q2-2025 | 2.64% | 2.06% | -0.02% | 0.22% | 0.10% | 0.12% |
Source: Indonesia Central Bureau of Statistics (BPS), processed by PHEI
Contribution to year-on-year GDP growth, in percentage points. Stacked, as in the printed edition.
Easing monetary cycle, balancing growth and stability
Indonesia’s monetary and external sector dynamics reflect a delicate balance between sustaining growth and maintaining financial stability. Bank Indonesia began a cautious easing cycle, lowering the BI 7-Day Reverse Repo Rate from 6.00% at end-2024 to 4.50% by September 2025, with room for further adjustment as inflation steadily declines within target, CPI eased to below 1% in beginning of 2025 and is targeted near 2.0% by 2025. The disinflation trend, supported by stable food and energy prices, enables greater policy flexibility to nurture domestic demand.
- CPI (YoY)
- BI Rate
Figures behind this chart
| First | Latest | Lowest | Highest | |
|---|---|---|---|---|
| CPI (YoY) | 1.87%Dec 2021 | 2.00%Dec 2025 | -0.09%Feb 2025 | 5.95%Sep 2022 |
| BI Rate | 3.50%Dec 2021 | 4.50%Dec 2025 | 3.50%Dec 2021 | 6.25%Apr 2024 |
Source: Bank Indonesia, BPS and Bloomberg, processed by PHEI
However, the rupiah faced renewed depreciation pressures, reversing earlier stability as global investors favored U.S. assets and external sentiment turned risk-averse. The USD/IDR trended upward through 2025, driven by persistent dollar strength and moderating trade surpluses, prompting measured interventions by Bank Indonesia through spot and DNDF markets to smooth volatility.
Figures behind this chart
| First | Latest | Lowest | Highest | |
|---|---|---|---|---|
| USD/IDR | 153992023-12-29 | 166922025-09-30 | 151022024-09-25 | 168802025-04-23 |
Source: Bank Indonesia, processed by PHEI
Daily observations thinned to every third trading day for this chart.
Meanwhile, foreign exchange reserves remained robust above USD 140 billion, providing over six months of import coverage and reinforcing confidence in Indonesia’s external position. Together, these developments highlight a period of controlled adjustment, where easing inflation supports monetary flexibility, yet global volatility and currency pressures continue to test Indonesia’s external resilience heading into 2026.
Figures behind this chart
| First | Latest | Lowest | Highest | |
|---|---|---|---|---|
| Reserves, US$ billion | 144.9Dec 2021 | 148.7Sep 2025 | 130.2Oct 2022 | 157.1Mar 2025 |
Source: Bank Indonesia, processed by PHEI
Key business activity indicators
Key business activity indicators
| Indicator | End 2024 | Latest | Change | Period |
|---|---|---|---|---|
| Purchasing Manager’s Index (PMI) | 51.20 | 50.40 | -1.56% | Year to Sep Change |
| Consumer Confidence Index | 127.70 | 115.00 | -9.95% | Year to Sep Change |
| Retail Sales | 1.80 | 3.50 | +94.44% | Year to Aug Change |
Source: Bloomberg, processed by PHEI
Indonesia’s domestic demand indicators present a mixed yet resilient picture of economic momentum. The Purchasing Managers’ Index (PMI) stood at 50.4, down from 51.2 in 2024, indicating a modest slowdown in manufacturing activity but still within expansionary territory. This suggests that production remains steady despite external headwinds from weaker global demand and currency volatility.
Figures behind this chart
| First | Latest | Lowest | Highest | |
|---|---|---|---|---|
| PMI | 53.5Dec 2021 | 50.4Sep 2025 | 46.7Apr 2025 | 54.2Mar 2024 |
Meanwhile, the Consumer Confidence Index (CCI) declined to 115.0 from 127.7 in 2024, a 9.95% year-to-date drop signaling softer household sentiment amid inflation concerns and higher borrowing costs in 1H2025. However, retail sales surged by +94.44% year-to-date, reflecting a strong rebound in consumer spending, particularly ahead of festive and election-related consumption cycles.
Figures behind this chart
| First | Latest | Lowest | Highest | |
|---|---|---|---|---|
| Consumer confidence index | 118.3Dec 2021 | 115.0Sep 2025 | 111.0Mar 2022 | 128.9May 2022 |
Together, these indicators portray an economy where manufacturing growth has plateaued, but consumer activity continues to drive resilience, supported by fiscal stimulus, a gradual easing of monetary conditions, and stable labor market fundamentals that sustain overall domestic momentum heading into late 2025.
Figures behind this chart
| First | Latest | Lowest | Highest | |
|---|---|---|---|---|
| Retail sales, year on year | 13.80%Dec 2021 | 3.50%Aug 2025 | -4.53%May 2023 | 15.16%Jan 2022 |
Source: Bloomberg, processed by PHEI
Narrowing surplus reflects weaker external cushion
Indonesia’s balance of payments (BoP) in 2025 shows signs of softening external resilience as both trade dynamics and capital inflows moderate amid a less favorable global environment. During the first half of the year, the current account recorded a deficit of around USD 7 billion in Q2, reversing the small surplus seen in late 2024. This shift reflects weaker commodity exports, particularly coal and palm oil, as global prices normalized from their 2022–2023 highs, alongside steady import demand driven by domestic investment activity.
Meanwhile, the capital and financial account also registered a net outflow of around USD 5 billion, largely due to foreign portfolio adjustments following global monetary tightening and renewed volatility in emerging-market currencies. Despite this, Indonesia’s overall BoP position remains manageable, supported by robust foreign direct investment (FDI) in manufacturing and downstream industries as well as foreign exchange reserves exceeding USD 140 billion, providing a solid liquidity buffer.
The BoP pattern highlights a narrowing external surplus compared with the 2022–2023 period, signaling a transition from commodity-led windfalls to more balanced structural growth. While the rupiah experienced depreciation pressure in mid-2025, Bank Indonesia’s calibrated interventions have limited volatility and preserved investor confidence. Going forward, the BoP outlook will depend on global demand recovery, stability in capital flows following the Fed’s easing cycle, and Indonesia’s continued progress in diversifying export earnings beyond raw commodities. Overall, the 2025 external position reflects a controlled adjustment phase, where the economy’s fundamentals remain intact even as global conditions test Indonesia’s external buffers.
- Current Transaction
- Capital & Financial Transaction
- Current Account Surplus/Deficit
Figures behind this chart
| Period | Current Transaction | Capital & Financial Transaction | Current Account Surplus/Deficit |
|---|---|---|---|
| Q1 2020 | -3924 | -2932 | -8545 |
| Q2 2020 | -2896 | 10524 | 9246 |
| Q3 2020 | 964 | 1042 | 2052 |
| Q4 2020 | 795 | -907 | -157 |
| Q1 2021 | -997 | 5562 | 4064 |
| Q2 2021 | -2231 | 1918 | -450 |
| Q3 2021 | 4474 | 6096 | 10689 |
| Q4 2021 | 1415 | -2354 | -844 |
| Q1 2022 | 221 | -1703 | -1817 |
| Q2 2022 | 3853 | -1082 | 2389 |
| Q3 2022 | 4376 | -6071 | -1304 |
| Q4 2022 | 4181 | 325 | 4730 |
| Q1 2023 | 2972 | 3380 | 6517 |
| Q2 2023 | -1933 | -4964 | -7371 |
| Q3 2023 | -860 | -282 | -1463 |
| Q4 2023 | -1290 | 9784 | 8617 |
| Q1 2024 | -2161 | -2302 | -5970 |
| Q2 2024 | -3021 | 2676 | -556 |
| Q3 2024 | -2150 | 6581 | 5866 |
| Q4 2024 | -1127 | 9652 | 7870 |
| Q1 2025 | -177 | -327 | -787 |
| Q2 2025 | -3014 | -5159 | -6742 |
Source: Bank Indonesia, processed by PHEI
US$ million per quarter.
Stable surplus amid moderating export momentum
Indonesia’s balance of trade remains in surplus through the first half of 2025, reflecting continued external resilience despite a gradual softening in global demand and commodity prices. In Q2 2025, exports reached USD 69 billion, up modestly from USD 67 billion in Q1, while imports increased more sharply to USD 60 billion, narrowing the quarterly surplus to USD 9 billion from USD 11 billion earlier in the year.
This indicates a mild compression in the trade surplus as domestic demand and capital goods imports strengthened alongside investment recovery. Compared to the peak commodity cycle of 2022–2023, Indonesia’s export performance has normalized, with key sectors such as coal, palm oil, and nickel experiencing lower average prices, partly offset by rising shipments of manufactured and downstream mineral products. Meanwhile, import growth, driven by machinery, raw materials, and consumer goods, signals firming domestic investment and consumption trends.
Overall, the trade balance remains structurally positive, supported by Indonesia’s diversified export base and disciplined import management. However, the surplus is narrowing compared to 2022–2023 highs, reflecting a maturing recovery phase and rebalancing of external accounts. As global trade conditions remain uncertain, the sustainability of the surplus will depend on Indonesia’s progress in expanding non-commodity exports and maintaining competitiveness through industrial downstreaming, logistics improvement, and export market diversification.
- Export
- Import
Figures behind this chart
| Period | Export | Import |
|---|---|---|
| Q1 2021 | 48904.3 | 43382.4 |
| Q2 2021 | 53966.0 | 47657.6 |
| Q3 2021 | 61418.5 | 48176.1 |
| Q4 2021 | 67251.9 | 56980.4 |
| Q1 2022 | 66144.1 | 56812.0 |
| Q2 2022 | 74982.2 | 60958.2 |
| Q3 2022 | 78202.5 | 63303.9 |
| Q4 2022 | 72650.5 | 58037.3 |
| Q1 2023 | 67061.1 | 54950.2 |
| Q2 2023 | 61592.2 | 53777.7 |
| Q3 2023 | 63606.8 | 55791.7 |
| Q4 2023 | 66558.8 | 57366.1 |
| Q1 2024 | 62303.7 | 54895.8 |
| Q2 2024 | 62785.5 | 54745.4 |
| Q3 2024 | 67733.1 | 61226.2 |
| Q4 2024 | 71880.8 | 62792.1 |
| Q1 2025 | 66619.8 | 55704.9 |
| Q2 2025 | 68794.1 | 60230.3 |
US$ billion per quarter.
Figures behind this chart
| Period | Trade balance surplus |
|---|---|
| Q1 2021 | 5521.9 |
| Q2 2021 | 6308.4 |
| Q3 2021 | 13242.4 |
| Q4 2021 | 10271.5 |
| Q1 2022 | 9332.1 |
| Q2 2022 | 14024.0 |
| Q3 2022 | 14898.6 |
| Q4 2022 | 14613.2 |
| Q1 2023 | 12110.9 |
| Q2 2023 | 7814.5 |
| Q3 2023 | 7815.1 |
| Q4 2023 | 9192.7 |
| Q1 2024 | 7407.9 |
| Q2 2024 | 8040.1 |
| Q3 2024 | 6506.9 |
| Q4 2024 | 9088.7 |
| Q1 2025 | 10914.9 |
| Q2 2025 | 8563.8 |
Source: Indonesia Central Bureau of Statistics (BPS), processed by PHEI
US$ billion per quarter.
Fiscal position: softer revenue growth and targeted spending keep deficit in check
Indonesia’s fiscal performance through September 2025 indicates a period of moderate revenue growth and disciplined expenditure management as the government balances fiscal consolidation with efforts to sustain domestic demand. Based on the latest data, state revenue growth has slowed, reflecting weaker tax collections amid declining commodity prices and moderating global trade activity. Non-oil and gas tax receipts and VAT performance were softer than a year earlier, while income tax growth was constrained by lower corporate profits in export-oriented sectors. Non-tax revenue (PNBP) provided partial support, especially from the energy, mineral, and SOE dividend components—but not enough to offset weaker tax inflows. On the expenditure side, the government maintained targeted spending, focusing on infrastructure, social assistance, and energy subsidies while containing non-priority outlays to preserve fiscal discipline.
As a result, the fiscal deficit remains manageable, below 3 % of GDP, consistent with Indonesia’s post-pandemic fiscal normalization framework. The government has financed the shortfall mainly through domestic bond issuance, supported by resilient demand from local investors and selective foreign participation. Meanwhile, public debt remains stable at around 39 % of GDP, comfortably below the statutory ceiling and signaling sound debt sustainability. Going into late 2025, fiscal policy is expected to remain cautiously supportive, emphasizing efficient revenue collection, improved tax administration, and the expansion of non-tax income sources to safeguard macroeconomic stability.
Overall, Indonesia’s 2025 fiscal stance reflects resilience amid revenue headwinds, anchored by prudence, targeted fiscal support, and credible debt management that sustain investor confidence and economic stability.
State budget realisation
| IDRtn - unless stated otherwise | Sep-24 | Aug-25 | Sep-25 | % m-o-m | % y-o-y | 9M24 | 9M25 | % y-o-y |
|---|---|---|---|---|---|---|---|---|
| A. Revenue and Grant | 231.02 | 211.90 | 224.60 | 6.00 | -2.80 | 2,008.30 | 1,863.00 | -7.20 |
| Tax Revenues | 181.70 | 171.50 | 186.20 | 8.60 | 2.50 | 1,561.50 | 1,516.60 | -2.90 |
| Domestic Tax | 158.20 | 145.40 | 159.80 | 9.90 | 1.00 | 1,354.80 | 1,295.30 | -4.40 |
| Excises Duties and Int'l Tax | 23.50 | 24.90 | 36.40 | 6.00 | 12.30 | 206.70 | 221.30 | 7.10 |
| Non-Tax Revenue | 46.00 | 40.00 | 38.20 | -4.50 | -16.90 | 430.10 | 344.90 | -19.80 |
| Grant | 3.40 | 0.40 | 0.20 | -48.70 | -94.00 | 16.70 | 1.80 | -89.20 |
| B. Expenditure | 320.90 | 294.20 | 274.50 | -6.70 | -14.50 | 2,251.60 | 2,234.80 | -0.70 |
| Central Government | 247.60 | 195.10 | 201.10 | 3.10 | -18.80 | 1,616.10 | 1,589.90 | -1.60 |
| Personnel | 34.90 | 36.40 | 37.60 | 3.30 | 7.60 | 367.20 | 389.50 | 6.10 |
| Material | 37.00 | 41.80 | 46.00 | 10.00 | 24.30 | 293.70 | 278.50 | -5.20 |
| Capital | 26.10 | 20.20 | 33.20 | 64.40 | 27.20 | 179.10 | 173.10 | -3.40 |
| Subsidies | 34.80 | 32.00 | 26.60 | -16.90 | -23.60 | 181.80 | 176.00 | -3.20 |
| Social Assistance | 15.70 | 18.20 | 11.60 | -36.30 | 26.20 | 111.60 | 112.70 | 1.00 |
| Interest Expense | 45.80 | 46.30 | 45.90 | -0.90 | 0.20 | 361.30 | 388.60 | 7.60 |
| Others (Energy Compensation, etc.) | 53.20 | 0.30 | 0.20 | -42.90 | -99.60 | 121.40 | 71.50 | -41.10 |
| Transfer to Region | 73.50 | 99.20 | 73.40 | -26.00 | -0.10 | 635.60 | 644.90 | 1.50 |
| C. Primary Balance | -44.10 | -36.00 | -4.00 | 118.00 | 16.80 | |||
| D. Surplus/(Deficit) | -89.90 | -82.30 | -49.90 | -243.30 | -371.80 | |||
| % of GDP | -0.41 | -0.34 | -0.21 | -1.06 | -1.53 | |||
| E. Budget Financing | 77.10 | -1.50 | 32.60 | 369.00 | 458.00 |
Source: Ministry of Finance, processed by PHEI
Global Financial Market
2025 edition material
This chapter carries the review of the 2025 edition and is awaiting replacement with 2026 data. Figures and cut-off dates are reproduced as published.
Divergent performance in equity market amid policy shifts and growth uncertainty
Global equity markets are exhibiting a two-speed dynamic: mega-cap U.S. indices such as the S&P 500 continue to outperform, buoyed by expectations of monetary easing and sustained technology leadership. Meanwhile, developed markets in Europe and Japan have seen modest gains performance as inflation remains sticky and global trade tensions persist. In Asia and emerging markets markets are navigating mixed signals from growth-momentum, currency pressure, and capital-flow volatility. The overall picture is one of risk-on sentiment being concentrated in the U.S., while elsewhere investors remain cautious, seeking selective opportunities amid a backdrop of divergent monetary policy, supply-chain disruption, and elevated geopolitical risk.
Equity index performance
| Index | Trend (Sep 2024 – Sep 2025) | Range | Ytd change |
|---|---|---|---|
| S&P 500 | 4,982.77 – 6,693.75 | +13.72% | |
| Dow Jones | 37,645.59 – 46,397.89 | +9.06% | |
| NASDAQ | 15,267.91 – 22,788.98 | +17.34% | |
| FTSE (United Kingdom) | 7,679.48 – 9,350.43 | +14.41% | |
| DAX (Germany) | 19,670.88 – 24,549.56 | +19.95% | |
| NIKKEI (Japan) | 31,136.58 – 45,754.93 | +12.63% | |
| SHANGHAI (China) | 3,096.58 – 3,883.56 | +15.84% | |
| KOSPI (South Korea) | 2,293.7 – 3,486.19 | +42.72% | |
| IHSG (Indonesia) | 5,967.99 – 8,126.56 | 13.86% | |
| KLCI (Malaysia) | 1,400.59 – 1,642.33 | -1.85% | |
| SET (Thailand) | 1,062.78 – 1,400.21 | -9.00% |
Source: Bloomberg, processed by PHEI
Stabilizing yields amid easing policies and divergent economic momentum
In 2025, global sovereign bond yields show a clear divergence across maturities, reflecting differing monetary cycles and growth outlooks. On the 2-year tenor, yields on U.S. Treasuries, UK Gilts, and German Bunds declined, signaling markets’ expectations of monetary easing following peak policy rates in 2024. This short-end compression underscores anticipation of central bank rate cuts as inflation continues to moderate. In contrast, China and Japan posted yield increases, driven by policy normalization in Japan and continued fiscal and credit stimulus in China aimed at stabilizing growth.
- US
- Germany
- UK
- Japan
- China
Figures behind this chart
| First | Latest | Lowest | Highest | |
|---|---|---|---|---|
| US | 0.12%Dec 2020 | 3.61%Sep 2025 | 0.11%Jan 2021 | 5.09%Oct 2023 |
| Germany | -0.71%Dec 2020 | 2.02%Sep 2025 | -0.77%Jul 2021 | 3.20%Sep 2023 |
| UK | -0.17%Dec 2020 | 3.98%Sep 2025 | -0.17%Dec 2020 | 5.25%Jun 2023 |
| Japan | -0.13%Dec 2020 | 0.94%Sep 2025 | -0.13%Dec 2020 | 0.94%Sep 2025 |
| China | 2.70%Dec 2020 | 1.43%Sep 2025 | 1.09%Dec 2024 | 2.79%Jan 2021 |
Daily series reduced to month-end observations for this chart.
Figures behind this chart
| Period | Change, basis points |
|---|---|
| UST | -63 |
| Germany | -6 |
| UK | -40 |
| China | 34 |
| Japan | 34 |
At the 10-year segment, yield movements diverged further: U.S. yields fell 42 bps, while long-term yields in Germany, UK, China, and Japan all rose. This widening differential reflects regional policy asymmetry, with U.S. markets pricing in easing and slower growth, while Europe and Asia contend with lingering inflation pressures and evolving policy transitions.
- UST
- Germany
- UK
- Japan
- China
Figures behind this chart
| First | Latest | Lowest | Highest | |
|---|---|---|---|---|
| UST | 0.91%Dec 2020 | 4.15%Sep 2025 | 0.91%Dec 2020 | 4.93%Oct 2023 |
| Germany | -0.57%Dec 2020 | 2.71%Sep 2025 | -0.57%Dec 2020 | 2.84%Sep 2023 |
| UK | 0.19%Dec 2020 | 4.70%Sep 2025 | 0.19%Dec 2020 | 4.72%Aug 2025 |
| Japan | 0.02%Dec 2020 | 1.64%Sep 2025 | 0.02%Dec 2020 | 1.64%Sep 2025 |
| China | 3.14%Dec 2020 | 1.86%Sep 2025 | 1.63%Jan 2025 | 3.28%Feb 2021 |
Daily series reduced to month-end observations for this chart.
Figures behind this chart
| Period | Change, basis points |
|---|---|
| UST | -42 |
| Germany | 35 |
| UK | 13 |
| China | 19 |
| Japan | 56 |
Source: Bloomberg, processed by PHEI
Indonesia Bond Market
2025 edition material
This chapter carries the review of the 2025 edition and is awaiting replacement with 2026 data. Figures and cut-off dates are reproduced as published.
Amid high uncertainty in the economy, Indonesia bond market record an outstanding performance
High geopolitical tension, uncertainty regarding monetary policy and Trump tariff create a high uncertainty in the economy, but even with all that situation Indonesia bond market still managed to record an outstanding performance
- INDOBeX-G
- INDOBeX-C
- ICBI
- ISIX
Figures behind this chart
| First | Latest | Lowest | Highest | |
|---|---|---|---|---|
| INDOBeX-G | 108.782024-01-01 | 124.352025-09-30 | 108.262024-04-30 | 124.792025-09-19 |
| INDOBeX-C | 107.832024-01-01 | 127.802025-09-30 | 107.782024-01-06 | 128.142025-09-19 |
| ICBI | 108.712024-01-01 | 124.532025-09-30 | 108.302024-04-30 | 124.962025-09-19 |
| ISIX | 108.622024-01-01 | 124.102025-09-30 | 108.622024-01-01 | 124.312025-09-19 |
Source: PHEI, processed
Daily series thinned to weekly observations for this chart.
What moved the market
- Q1-2024. Global inflation eased but remained above target; central banks held policy rates high. U.S. economy outperformed expectations amid resilient labor market and spending.
- Q2-2024. Fed signaled extended higher-for-longer stance China’s post-reopening momentum weakened
- Q3-2024. Global tariff tensions resurfaced amid Trump-era trade policies. Demand for emerging-market bonds surged on easing outlook and stable inflation.
- Q3-2024. Escalating geopolitical tensions and trade frictions Energy prices rose sharply following Middle East supply disruptions.
- Q4-2024. Global manufacturing slowdown deepened Sticky services inflation delayed expected rate-cut timeline in major economies.
- Q1-2025. U.S. inflation moderated further, reviving expectations of mid-year Fed cuts. Japan exited negative-rate policy, marking a major monetary policy shift.
- Q2-2025. Fed delivered first rate cut since 2022, triggering global bond rally. Indonesia’s GDP grew 5.12 % yoy; domestic demand and investment remained strong.
Outstanding total return performance contributed by capital gain through all segments
- Total Return Index
- Clean Price Index
Figures behind this chart
| Period | Total Return Index | Clean Price Index |
|---|---|---|
| Composite All | 9.34% | 3.90% |
| Government All | 9.30% | 3.92% |
| Corporate All | 10.01% | 3.63% |
| Syariah | 10.78% | 4.07% |
| Energy | 11.93% | 5.27% |
| Basic Materials | 11.48% | 4.10% |
| Industrials | 10.36% | 3.44% |
| Consumer Non-Cyclicals | 9.25% | 2.88% |
| Consumer Cyclicals | 8.67% | 2.84% |
| Healthcare | 11.31% | 3.58% |
| Financials | 9.13% | 3.37% |
| Properties & Real Estate | 11.27% | 4.77% |
| Infrastructures | 9.59% | 3.18% |
| Transportation & Logistic | 10.32% | 4.13% |
| AAA | 8.92% | 3.16% |
| AA | 10.23% | 4.03% |
| A | 11.64% | 4.17% |
| BBB | 10.91% | 2.56% |
Source: PHEI, processed
January to September 2025.
Different from last year, total return index not only gaining from coupon return but also from capital gain. Clean price index through all segments shows that capital gain contributed around 3 – 4% to Total return index, bringing the index to have an extraordinary performance this year.
The market formed a bull steepener
In the end of 2024, Indonesia Government Securities Yield Curve (IGSYC) formed a bear flattener pattern, however in since the beginning of 2025, market expect Fed rate cut cycle to continue in 2025 while Bank Indonesia also decide to eased monetary cycle earlier than Fed. This situation turns the market to form a Bull Steepeners, when short-term rates decrease faster relative to long-term rates.
- End 2024
- Q1 2025
- Q2 2025
- Q3 2025
Figures behind this chart
| First | Latest | Lowest | Highest | |
|---|---|---|---|---|
| End 2024 | 6.72%0.1 | 7.11%30 | 6.72%0.1 | 7.11%17 |
| Q1 2025 | 6.26%0.1 | 7.16%30 | 6.26%0.1 | 7.16%16 |
| Q2 2025 | 5.72%0.1 | 7.03%30 | 5.72%0.1 | 7.03%28 |
| Q3 2025 | 4.80%0.1 | 6.88%30 | 4.80%0.1 | 6.88%23 |
Tenor in years.
Figures behind this chart
| Period | Change, basis points |
|---|---|
| 0.1 | -192 |
| 1 | -198 |
| 2 | -191 |
| 3 | -176 |
| 4 | -157 |
| 5 | -138 |
| 6 | -118 |
| 7 | -101 |
| 8 | -86 |
| 9 | -73 |
| 10 | -62 |
| 11 | -53 |
| 12 | -46 |
| 13 | -41 |
| 14 | -36 |
| 15 | -33 |
| 16 | -30 |
| 17 | -29 |
| 18 | -27 |
| 19 | -26 |
| 20 | -25 |
| 21 | -24 |
| 22 | -24 |
| 23 | -24 |
| 24 | -23 |
| 25 | -23 |
| 26 | -23 |
| 27 | -23 |
| 28 | -23 |
| 29 | -23 |
| 30 | -23 |
Source: PHEI, processed
Figures behind this chart
| First | Latest | Lowest | Highest | |
|---|---|---|---|---|
| Spread, basis points | 53.2Jan 2016 | 141.3Sep 2025 | 12.0Dec 2024 | 263.8Jan 2022 |
Source: PHEI, processed
Daily series reduced to month-end observations for this chart.
Government bond primary market
- Total bid received
- Total bid accepted
Figures behind this chart
| Period | Total bid received | Total bid accepted |
|---|---|---|
| Q1-2024 | 519.3 | 230.9 |
| Q2-2024 | 348.7 | 154.0 |
| Q3-2024 | 551.7 | 199.2 |
| Q4-2024 | 312.9 | 184.2 |
| Q1-2025 | 491.2 | 222.2 |
| Q2-2025 | 622.4 | 208.0 |
| Q3-2025 | 1072.3 | 280.4 |
Rp trillion per quarter.
- Bid to cover ratio
- Average
Figures behind this chart
| Period | Bid to cover ratio | Average |
|---|---|---|
| Q1-2024 | 2.25x | 2.57x |
| Q2-2024 | 2.26x | 2.57x |
| Q3-2024 | 2.77x | 2.57x |
| Q4-2024 | 1.70x | 2.57x |
| Q1-2025 | 2.21x | 2.57x |
| Q2-2025 | 2.99x | 2.57x |
| Q3-2025 | 3.82x | 2.57x |
Source: Ministry of Finance, as of Sep 2025, processed by PHEI
Ìn the primary market, investor demand during Q1 - Q3 2025 increased significantly compared to previous year, Total bid received in Q1 – Q3 2025 increase by 153.97% compared to Q1 – Q3 2024. While the demand increase, the supply side of government bond remain stable with Total bid accepted only increase by 21.65% in Q1 – Q3 2025 compared with Q1 – Q3 2024. Stable inflation and lower interest rates seems to drive the market goes for bonds over other instrument.
Government bond instrument has been dominated by fixed rate type with outstanding reached Rp4,292.05 trillion, followed by sukuk type bond with outstanding reached Rp1,596.35 trillion.
Figures behind this chart
| Period | Outstanding |
|---|---|
| Fixed Rate (FR) | 4292.05 |
| ORI | 137.06 |
| Global Bond (EUR) | 164.64 |
| Global Bond (US Dollar) | 910.28 |
| Global Bond (Yen) | 61.60 |
| Global Bond (Australian Dollar) | 8.82 |
| Variable Rate (VR) | 774.11 |
| SPN | 58.65 |
| Sukuk | 1596.35 |
Source: Ministry of Finance, processed by PHEI
Rp trillion, as at September 2025.
Government bond remain solid with Bank as a pillar
- 2024
- 2025 year to date
Figures behind this chart
| Period | 2024 | 2025 year to date |
|---|---|---|
| Others | 66.7 | 22.7 |
| Individual | 107.0 | 17.4 |
| Non Resident | 35.5 | 30.6 |
| Insurance & Pension Fund | 103.8 | 70.1 |
| Mutual Fund | 9.2 | 16.3 |
| Bank Indonesia | 516.5 | -57.6 |
| Bank | -438.3 | 317.4 |
Rp trillion.
Ownership composition in government bond (SBN) market has been dynamic for over the past 5 years. While foreign investor ownership remain low since pandemic, now government bond was supported by local investor.
As of September 2025, Bank Indonesia remain as the biggest holder with ownership 24.1% of SBN, the ownership are decreasing from 2024 which 26.7% of SBN. The biggest shift in the ownership of SBN in 2025 is the Banking, while other segments are decreasing, Banking remain as a solid pillar for SBN in 2025 with ownership increase to 21.3% from 17.5% in 2024, the bond net flow for Banking itself in 2025 was around Rp317.43 trillion.
The shifting ownership portion in SBN may still occur regularly but as we can see, local investor stood as a pillar for Indonesia Government Bond.
- Bank
- Bank Indonesia
- Mutual Fund
- Insurance & Pension Fund
- Non Resident
- Individual
- Others
Figures behind this chart
| Period | Bank | Bank Indonesia | Mutual Fund | Insurance & Pension Fund | Non Resident | Individual | Others |
|---|---|---|---|---|---|---|---|
| 2020 | 35.5% | 11.7% | 4.2% | 14.0% | 25.2% | 3.4% | 6.0% |
| 2021 | 34.0% | 17.1% | 3.4% | 14.0% | 19.0% | 4.7% | 7.7% |
| 2022 | 32.0% | 19.2% | 2.7% | 16.4% | 14.4% | 6.5% | 8.8% |
| 2023 | 26.5% | 19.4% | 3.2% | 18.5% | 14.9% | 7.7% | 9.8% |
| 2024 | 17.5% | 26.7% | 3.1% | 19.0% | 14.5% | 9.0% | 10.2% |
| 2025ytd | 21.3% | 24.1% | 3.1% | 18.8% | 14.1% | 8.7% | 9.9% |
Source: Ministry of Finance, processed by PHEI
Corporate bond yield decreased across tenor and rating group
- IGS
- AAA
- AA
- A
- BBB
Figures behind this chart
| Period | IGS | AAA | AA | A | BBB |
|---|---|---|---|---|---|
| 0.1 | 4.80% | 5.25% | 5.39% | 6.21% | 7.16% |
| 1 | 4.90% | 5.50% | 5.66% | 6.81% | 8.48% |
| 2 | 5.04% | 5.67% | 5.85% | 7.12% | 9.01% |
| 3 | 5.21% | 5.86% | 6.04% | 7.40% | 9.34% |
| 4 | 5.42% | 6.08% | 6.25% | 7.72% | 9.69% |
| 5 | 5.63% | 6.33% | 6.47% | 8.04% | 10.06% |
| 6 | 5.83% | 6.56% | 6.69% | 8.35% | 10.44% |
| 7 | 6.02% | 6.78% | 6.89% | 8.62% | 10.77% |
| 8 | 6.19% | 6.98% | 7.08% | 8.84% | 11.06% |
| 9 | 6.33% | 7.14% | 7.23% | 9.01% | 11.28% |
| 10 | 6.45% | 7.27% | 7.36% | 9.14% | 11.45% |
Tenor in years, as at September 2025.
Corporate bond yield change, year to September (basis points)
| Tenor (Year) | IGS | AAA | AA | A | BBB |
|---|---|---|---|---|---|
| 0.1 | -192.08 | -156.57 | -174.82 | -147.85 | -200.49 |
| 1 | -198.16 | -160.89 | -182.57 | -189.71 | -169.28 |
| 2 | -191.32 | -154.10 | -181.68 | -206.06 | -163.47 |
| 3 | -176.32 | -143.05 | -174.41 | -203.68 | -161.58 |
| 4 | -157.45 | -129.99 | -163.66 | -191.10 | -153.40 |
| 5 | -137.55 | -115.84 | -151.47 | -174.03 | -138.34 |
| 6 | -118.38 | -101.40 | -139.21 | -156.12 | -119.30 |
| 7 | -100.95 | -87.45 | -127.72 | -139.53 | -99.42 |
| 8 | -85.70 | -74.61 | -117.48 | -125.25 | -80.95 |
| 9 | -72.77 | -63.28 | -108.65 | -113.61 | -65.10 |
| 10 | -62.04 | -53.63 | -101.26 | -104.49 | -52.24 |
Corporate bond credit spread over government, year to September (basis points)
| Tenor (Year) | AAA spread | AAA change | AA spread | AA change | A spread | A change | BBB spread | BBB change |
|---|---|---|---|---|---|---|---|---|
| 0.1 | 45.20 | +35.51 | 58.98 | +17.27 | 141.31 | +44.22 | 236.28 | -8.40 |
| 1 | 60.07 | +37.27 | 76.03 | +15.58 | 191.11 | +8.45 | 358.61 | +28.88 |
| 2 | 63.82 | +37.22 | 81.70 | +9.65 | 208.69 | -14.74 | 397.68 | +27.86 |
| 3 | 64.93 | +33.27 | 82.82 | +1.91 | 218.97 | -27.36 | 412.66 | +14.74 |
| 4 | 66.79 | +27.46 | 83.28 | -6.21 | 229.95 | -33.65 | 426.98 | +4.05 |
| 5 | 69.70 | +21.71 | 84.16 | -13.92 | 241.36 | -36.48 | 443.63 | -0.80 |
| 6 | 73.07 | +16.99 | 85.53 | -20.83 | 251.56 | -37.75 | 460.44 | -0.92 |
| 7 | 76.30 | +13.50 | 87.14 | -26.78 | 259.47 | -38.58 | 475.21 | +1.53 |
| 8 | 79.03 | +11.09 | 88.74 | -31.77 | 264.81 | -39.55 | 486.81 | +4.75 |
| 9 | 81.11 | +9.49 | 90.17 | -35.88 | 267.85 | -40.84 | 495.11 | +7.67 |
| 10 | 82.55 | +8.41 | 91.36 | -39.21 | 269.08 | -42.44 | 500.51 | +9.80 |
Decreasing yield was observed across tenors and rating group. Based on tenors, overall the corporate bond yield curve formed bull steepener pattern with the short tenors (<5yr) yield decreased faster. While based on rating, A group recorded the biggest drop in yield.
Corporate bond yield curve trend by rating
- 1 year
- 3 year
- 5 year
Figures behind this chart
| First | Latest | Lowest | Highest | |
|---|---|---|---|---|
| 1 year | 8.45%Jan 2010 | 5.50%Sep 2025 | 4.03%Feb 2022 | 10.07%Sep 2015 |
| 3 year | 9.61%Jan 2010 | 5.86%Sep 2025 | 5.32%Nov 2021 | 11.09%Sep 2015 |
| 5 year | 10.50%Jan 2010 | 6.33%Sep 2025 | 6.25%Nov 2021 | 11.34%Sep 2015 |
Daily series reduced to month-end observations for this chart.
| Change, year to September (bp) | 1 Year | 3 Year | 5 Year |
|---|---|---|---|
| Yield Change | -160.88 | -143.06 | -115.83 |
| Credit Spread Change | +37.27 | +33.27 | +21.71 |
- 1 year
- 3 year
- 5 year
Figures behind this chart
| First | Latest | Lowest | Highest | |
|---|---|---|---|---|
| 1 year | 9.11%Jan 2010 | 5.66%Sep 2025 | 4.40%Feb 2022 | 10.51%Sep 2015 |
| 3 year | 10.38%Jan 2010 | 6.04%Sep 2025 | 6.04%Feb 2022 | 11.56%Sep 2015 |
| 5 year | 11.34%Jan 2010 | 6.47%Sep 2025 | 6.47%Sep 2025 | 12.04%Sep 2015 |
Daily series reduced to month-end observations for this chart.
| Change, year to September (bp) | 1 Year | 3 Year | 5 Year |
|---|---|---|---|
| Yield Change | -182.58 | -174.41 | -151.47 |
| Credit Spread Change | +15.58 | +1.91 | -13.92 |
- 1 year
- 3 year
- 5 year
Figures behind this chart
| First | Latest | Lowest | Highest | |
|---|---|---|---|---|
| 1 year | 9.92%Jan 2010 | 6.81%Sep 2025 | 6.44%Feb 2022 | 11.42%Sep 2015 |
| 3 year | 11.22%Jan 2010 | 7.40%Sep 2025 | 7.40%Sep 2025 | 12.47%Sep 2015 |
| 5 year | 12.65%Jan 2010 | 8.04%Sep 2025 | 8.04%Sep 2025 | 12.87%Sep 2015 |
Daily series reduced to month-end observations for this chart.
| Change, year to September (bp) | 1 Year | 3 Year | 5 Year |
|---|---|---|---|
| Yield Change | -189.71 | -203.68 | -174.03 |
| Credit Spread Change | +8.45 | -27.36 | -36.48 |
- 1 year
- 3 year
- 5 year
Figures behind this chart
| First | Latest | Lowest | Highest | |
|---|---|---|---|---|
| 1 year | 10.81%Jan 2010 | 8.48%Sep 2025 | 8.36%Jul 2021 | 12.47%Sep 2015 |
| 3 year | 12.57%Jan 2010 | 9.34%Sep 2025 | 9.34%Sep 2025 | 14.13%Sep 2015 |
| 5 year | 13.99%Jan 2010 | 10.06%Sep 2025 | 10.06%Sep 2025 | 15.08%Sep 2015 |
Daily series reduced to month-end observations for this chart.
| Change, year to September (bp) | 1 Year | 3 Year | 5 Year |
|---|---|---|---|
| Yield Change | -169.27 | -161.58 | -138.34 |
| Credit Spread Change | +28.88 | +14.74 | -0.80 |
Source: PHEI, as at September 2025
Corporate bond issuance at the highest level
Corporate bond supply that has been decreased in 2023, continue to increase for the last 2 years. Decreasing borrowing cost pushed issuance in 2024 higher to Rp142.72 trillion or increase from Rp124.97 trillion in 2023, this year corporate bond issuance goes even higher to Rp167.69 trillion. This number was higher than bond maturity amount, suggesting refinancing as a purpose and also lower borrowing cost.
Corporate bond types are less diverse with fixed rate bonds have dominated the market. Fixed rate bond comprised 84.41% with outstanding reached Rp387.37 trillion in Q3-2024. While corporate sukuk placed the second biggest outstanding with 10.78% of total corporate bond outstanding.
- New Issuance
- Mature
Figures behind this chart
| Period | New Issuance | Mature |
|---|---|---|
| 2020 | 88.88 | 107.16 |
| 2021 | 107.25 | 106.46 |
| 2022 | 153.92 | 143.22 |
| 2023 | 124.97 | 116.55 |
| 2024 | 142.72 | 134.89 |
| 2025* | 167.69 | 150.94 |
Source: KSEI, processed by PHEI, 2025 as at 30 September
Rp trillion.
Figures behind this chart
| Period | Share |
|---|---|
| Fixed Rate | 80.80% |
| SubDebt Fixed Coupon | 1.72% |
| Sukuk | 14.26% |
| EBA | 0.41% |
Source: KSEI, processed by PHEI
Higher issuance with high demand push the ownership of corporate bonds
- 2024
- 2025 year to date
Figures behind this chart
| Period | 2024 | 2025 year to date |
|---|---|---|
| Insurance & Pension Fund | -10.33 | 3.33 |
| Corporates | 2.78 | -0.10 |
| Bank | 3.12 | 11.04 |
| Individual | 4.42 | 2.05 |
| Mutual Fund | 7.74 | 36.26 |
| Securities Company | 0.78 | -0.85 |
| Foundation | 0.05 | 0.42 |
| Others | 5.57 | 0.12 |
| Non Resident | -4.68 | -1.87 |
Rp trillion.
As of September 2025, Insurance & pension fund still recorded as the biggest corporate bond ownership with 31.73%, followed by Mutual fund and Banking with 30.45% and 21.05%.
In terms of the net flow, Mutual funds remain as a loyal investor for corporate bond with Rp36.26 trillion net flow since the beginning of 2025, followed by Banking with Rp11.04 trillion. There’s not much changes in the ownership of corporate bond because of the reinvestment trend in the market.
Figures behind this chart
| Period | Holding |
|---|---|
| Insurance & Pension Fund | 170.68 |
| Corporates | 22.27 |
| Bank | 113.24 |
| Individual | 38.11 |
| Mutual Fund | 163.81 |
| Securities Company | 2.31 |
| Foundation | 6.92 |
| Others | 16.45 |
| Non Resident | 4.11 |
Source: KSEI, processed by PHEI, as at 30 September 2025
Rp trillion.
Indonesia Bond Trading
2025 edition material
This chapter carries the review of the 2025 edition and is awaiting replacement with 2026 data. Figures and cut-off dates are reproduced as published.
Trading activity in both government and corporate bonds picked up sharply in 2025
Last year, the average monthly transaction volume of government bond for outright transaction decreased by -2.01% to Rp40,065 billion/month compared with Rp40,887 billion/month in 2023. The average monthly transaction frequency also decreased by -11.46% to 4,102/month in 2024 from 4,663/month in 2023. Meanwhile in 2025, average monthly transaction & frequency of government bond for outright transaction both increase significant by 73.80% and 32.44%.
Figures behind this chart
| Period | Average daily volume |
|---|---|
| 2021 | 24446 |
| 2022 | 20601 |
| 2023 | 23022 |
| 2024 | 22388 |
| Jan 2025 | 21893 |
| Feb 2025 | 36630 |
| Mar 2025 | 29632 |
| Apr 2025 | 21659 |
| May 2025 | 30834 |
| Jun 2025 | 33969 |
| Jul 2025 | 33525 |
| Aug 2025 | 38376 |
| Sep 2025 | 39907 |
Rp billion. The first columns are annual averages; the rest are months of 2025.
Figures behind this chart
| Period | Average daily frequency |
|---|---|
| 2021 | 2008 |
| 2022 | 2066 |
| 2023 | 2899 |
| 2024 | 3469 |
| Jan 2025 | 3816 |
| Feb 2025 | 3684 |
| Mar 2025 | 3782 |
| Apr 2025 | 4523 |
| May 2025 | 3734 |
| Jun 2025 | 3690 |
| Jul 2025 | 3565 |
| Aug 2025 | 4197 |
| Sep 2025 | 3997 |
Figures behind this chart
| Period | Average daily volume |
|---|---|
| 2020 | 1463 |
| 2021 | 1281 |
| 2022 | 1734 |
| 2023 | 2053 |
| 2024 | 2020 |
| Jan 2025 | 2061 |
| Feb 2025 | 2386 |
| Mar 2025 | 4560 |
| Apr 2025 | 3870 |
| May 2025 | 3384 |
| Jun 2025 | 3906 |
| Jul 2025 | 5498 |
| Aug 2025 | 3444 |
Rp billion. The first columns are annual averages; the rest are months of 2025.
Figures behind this chart
| Period | Average daily frequency |
|---|---|
| 2020 | 152 |
| 2021 | 143 |
| 2022 | 214 |
| 2023 | 233 |
| 2024 | 224 |
| Jan 2025 | 229 |
| Feb 2025 | 309 |
| Mar 2025 | 292 |
| Apr 2025 | 248 |
| May 2025 | 304 |
| Jun 2025 | 397 |
| Jul 2025 | 278 |
| Aug 2025 | 245 |
Source: IDX CTP, processed by PHEI
Top 10 Trading Government Bond
2025 edition material
This chapter carries the review of the 2025 edition and is awaiting replacement with 2026 data. Figures and cut-off dates are reproduced as published.
Top 10 government bond series by trading volume and frequency
The ten most actively traded government series over the period covered by this edition, ranked by outright trading volume and by number of transactions.
Figures behind this chart
| Period | Volume, Rp trillion |
|---|---|
| FR0100 | 859.05 |
| FR0101 | 612.92 |
| FR0103 | 387.70 |
| FR0098 | 296.78 |
| FR0096 | 262.09 |
| FR0097 | 254.52 |
| FR0081 | 223.41 |
| PBS032 | 217.54 |
| FR0104 | 204.28 |
| FR0087 | 162.72 |
Source: IDX CTP, processed by PHEI
As printed in the source edition, which labels the period FY 2024.
Figures behind this chart
| Period | Number of transactions |
|---|---|
| PBS032 | 59977 |
| FR0102 | 51240 |
| FR0100 | 47691 |
| FR0081 | 44363 |
| FR0097 | 38550 |
| FR0091 | 33413 |
| PBS038 | 31052 |
| PBS036 | 27506 |
| FR0089 | 23923 |
| FR0098 | 23812 |
Source: IDX CTP, processed by PHEI
As printed in the source edition, which labels the period FY 2024.
Top 10 Trading Corporate Bond
2025 edition material
This chapter carries the review of the 2025 edition and is awaiting replacement with 2026 data. Figures and cut-off dates are reproduced as published.
Top 10 corporate bond series by trading volume and frequency
The ten most actively traded corporate series over the period covered by this edition, ranked by outright trading volume and by number of transactions.
Figures behind this chart
| Period | Volume, Rp trillion |
|---|---|
| MDKA03BCN1 | 21.88 |
| OPPM03B | 14.06 |
| SMARMA01 | 11.51 |
| MDKA03BCN3 | 10.00 |
| LPPI01BCN2 | 9.24 |
| SIBALI01CN2 | 8.53 |
| TBIG06CN3 | 6.60 |
| SMINKP03BCN2 | 5.99 |
| SMMF03BCN1 | 5.94 |
| SMWIKA02ACN2 | 5.80 |
Source: IDX CTP, processed by PHEI
As printed in the source edition, which labels the period FY 2024.
Figures behind this chart
| Period | Number of transactions |
|---|---|
| SPSMFBRIS01A | 1818 |
| SPSMFBTN08A | 1410 |
| INKP04BCN5 | 1187 |
| SPSMFBTN06A | 927 |
| INKP04BCN4 | 754 |
| LPPI02ACN1 | 646 |
| SMMA02DCN2 | 640 |
| SMMF03BCN1 | 618 |
| LPPI01BCN2 | 617 |
| MDKA03BCN1 | 576 |
Source: IDX CTP, processed by PHEI
As printed in the source edition, which labels the period FY 2024.
Top 10 Bond Total Return
2025 edition material
This chapter carries the review of the 2025 edition and is awaiting replacement with 2026 data. Figures and cut-off dates are reproduced as published.
Top 10 bonds by total return
The best performing government and corporate series by total return over the period covered by this edition.
Figures behind this chart
| Period | Total return |
|---|---|
| IFR0010 | 9.49% |
| PBS022 | 8.48% |
| PBS015 | 8.48% |
| IFR0006 | 8.24% |
| FR0050 | 8.21% |
| FR0057 | 7.99% |
| PBS024 | 7.95% |
| PBS012 | 7.91% |
| PBS007 | 7.69% |
Source: PHEI, processed
As printed in the source edition, which labels the period FY 2024.
Figures behind this chart
| Period | Total return |
|---|---|
| IJEE01C | 21.04% |
| SMLPPI01CN1 | 20.52% |
| WIKA02CCN1 | 18.42% |
| INKP05BCN1 | 18.34% |
| SMINKP04BCN1 | 17.95% |
| BCAP04CCN2 | 17.42% |
| LPPI02CCN4 | 17.04% |
| LPPI02CCN3 | 16.75% |
| OPPM01CGNCN5 | 16.67% |
Source: PHEI, processed
As printed in the source edition, which labels the period FY 2024.
Indonesia Bond Market Guidance
How the Indonesian bond market is organised: the trading mechanism, the institutions and platforms behind it, the government instruments, and the regulatory changes of the past year.
Bond Trading Mechanism
[How bonds trade in Indonesia: over-the-counter negotiation, reporting obligations, settlement cycle.]
- Price discovery and negotiation
- Trade execution
- Reporting through the exchange (PLTE)
- Clearing and settlement
- Registry and custody
Bond Trading Institutions
[The institutions behind the market: regulator, exchange, clearing house, central custodian, pricing agency, rating agencies and trustees.]
Institutions and their roles
| Institution | Role |
|---|---|
| [–] | [–] |
| [–] | [–] |
| [–] | [–] |
| [–] | [–] |
| [–] | [–] |
| [–] | [–] |
| [–] | [–] |
Fill in: OJK, IDX, KPEI, KSEI, PHEI, rating agencies, trustees.
Bond Trading Platforms
[Trading and reporting platforms: SPPA, PLTE, FITS and other electronic venues.]
Government Debt Securities Instruments
[The instrument families issued by the Government of Indonesia and how they differ.]
Instrument overview
| Instrument | Basis | Tenor | Coupon | Investor base |
|---|---|---|---|---|
| [–] | [–] | [–] | [–] | [–] |
| [–] | [–] | [–] | [–] | [–] |
| [–] | [–] | [–] | [–] | [–] |
| [–] | [–] | [–] | [–] | [–] |
| [–] | [–] | [–] | [–] | [–] |
| [–] | [–] | [–] | [–] | [–] |
Placeholder rows — populate from the IBMD data set.
Indonesia Bond Market Regulation Update 2025-2026
[New and amended regulations affecting the bond market during 2025–2026, with effective dates and practical impact.]
Regulation update
| Regulation | Issued by | Effective | Summary |
|---|---|---|---|
| [–] | [–] | [–] | [–] |
| [–] | [–] | [–] | [–] |
| [–] | [–] | [–] | [–] |
| [–] | [–] | [–] | [–] |
Placeholder rows — populate from the IBMD data set.
Government Bonds
The complete listing of outstanding government securities — conventional, sharia and retail — with the trading highlight of the year. Each section opens on its own page.
Corporate Bonds
One profile page per issuer, in alphabetical order of trading code. Each issuer opens on its own page — use the sidebar search to jump straight to a code or name.
Bond Market Indicator
The indicator section closes the directory: the PHEI index family, the regional A3GBI benchmark, the bond market beta report and the glossary.
Indonesia Bond Indexes
The PHEI index family: ICBI, INDOBeX Government, INDOBeX Corporate, ISIX, ISIXG and ISIXC — specification, constituents and performance.
Index family, closing levels and returns
| Index | Closing level | Return YTD (%) | Duration (yrs) | Constituents |
|---|---|---|---|---|
| [–] | [–] | [–] | [–] | [–] |
| [–] | [–] | [–] | [–] | [–] |
| [–] | [–] | [–] | [–] | [–] |
| [–] | [–] | [–] | [–] | [–] |
| [–] | [–] | [–] | [–] | [–] |
| [–] | [–] | [–] | [–] | [–] |
Placeholder rows — populate from the IBMD data set.
ASEAN-3 Government Bond Index (A3GBI)
[The ASEAN-3 Government Bond Index: coverage, methodology and performance of the regional government bond benchmark.]
A3GBI performance
| Market | Weight (%) | Return YTD (%) | Yield (%) | Duration (yrs) |
|---|---|---|---|---|
| [–] | [–] | [–] | [–] | [–] |
| [–] | [–] | [–] | [–] | [–] |
| [–] | [–] | [–] | [–] | [–] |
Placeholder rows — populate from the IBMD data set.
PHEI Bond Market Beta
Beta measures how strongly a segment moves with the market as a whole, estimated against the composite index over a rolling window of daily total returns.
Estimated beta by market segment
| Segment | Beta | R² | Tracking error (%) |
|---|---|---|---|
| [–] | [–] | [–] | [–] |
| [–] | [–] | [–] | [–] |
| [–] | [–] | [–] | [–] |
| [–] | [–] | [–] | [–] |
| [–] | [–] | [–] | [–] |
| [–] | [–] | [–] | [–] |
| [–] | [–] | [–] | [–] |
Placeholder rows — populate from the IBMD data set.
Glossary
Terms, abbreviations and rating symbols used throughout the directory. The full glossary opens as a separate document.
PHEI
PT Penilai Harga Efek Indonesia · [registered office address] · www.phei.co.id
Contact
| Enquiry | Contact |
|---|---|
| [–] | [–] |
| [–] | [–] |
| [–] | [–] |
| [–] | [–] |
Data subscription, methodology, issuer profile updates and general enquiries.